Crop Markets
USDA Raises Corn Forecast as Soybean Production Hits Record High
USDA's October Crop Production report raised the 2026 corn forecast to 16.0 billion bushels and put soybean production at a record 4.56 billion bushels. The estimates point to different year-over-year supply patterns for the two crops as harvest continues.
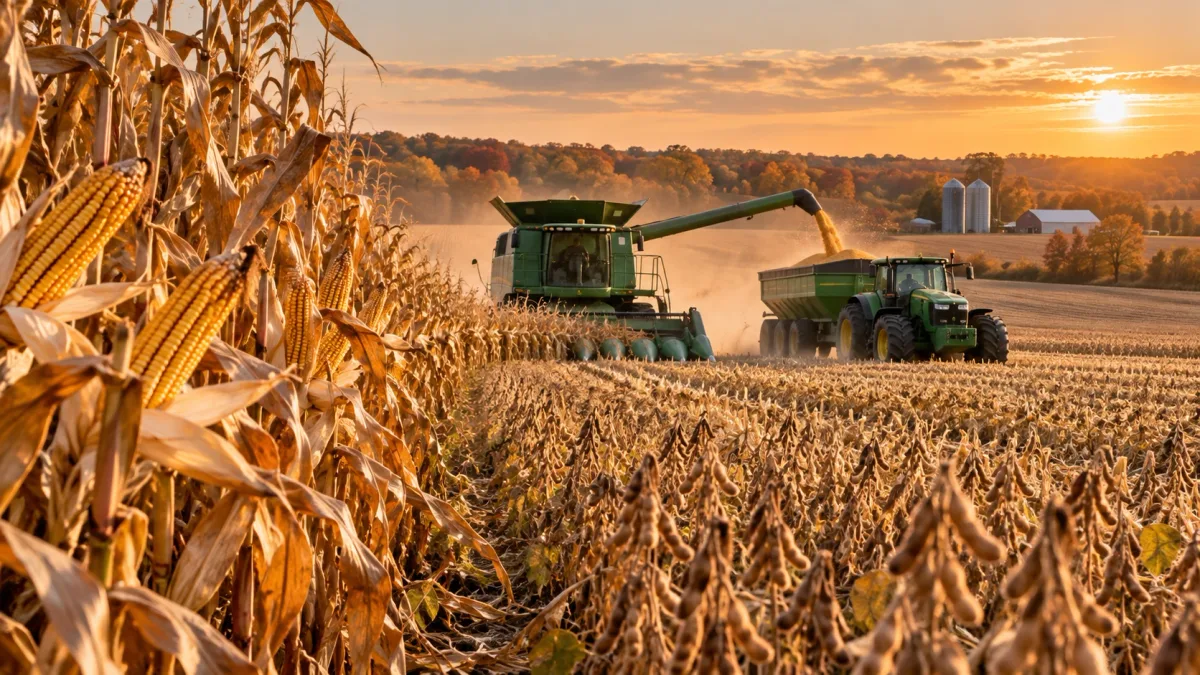
USDA's National Agricultural Statistics Service raised its 2026 corn production forecast in the October Crop Production report while placing soybean production at a new record high.
The report, released October 9 and based on conditions as of October 1, shows two different national supply pictures. Corn production remains exceptionally large but is forecast below last year's level, while soybean production is expected to exceed 2025 as harvested acreage increases and the national average yield edges higher.
These numbers are still forecasts rather than final harvest totals. NASS prepared them while harvest was incomplete, so later estimates can change as additional field information becomes available.
Key Facts
- U.S. corn production is forecast at 16.0 billion bushels, up 1% from the previous forecast but down 5% from 2025.
- The 2026 U.S. corn yield is forecast at 181.2 bushels per acre, 2.7 bushels above the previous forecast but 5.3 bushels below 2025.
- U.S. soybean production is forecast at a record 4.56 billion bushels, up 1% from the previous forecast and 7% from 2025.
- The national soybean yield is forecast at a record 53.1 bushels per acre, 0.3 bushel above the previous forecast and 0.1 bushel above 2025.
- NASS says there is a 90% chance final production will fall between 15.5 and 16.6 billion bushels for corn and between 4.35 and 4.77 billion bushels for soybeans.
What the Source Reported
USDA NASS forecasts 2026 corn-for-grain production at about 16.0 billion bushels. Although that is 1% higher than the September forecast, it remains 5% below the 2025 crop. If realized, USDA says it would still be the second-largest U.S. corn crop on record.
The national corn yield forecast increased to 181.2 bushels per acre, compared with 178.5 bushels in the previous forecast. That improvement does not bring the national yield back to last year's 186.5 bushels per acre.
Harvested corn area is forecast at 88.506 million acres, compared with 90.948 million acres in 2025. The combination of fewer harvested acres and a lower average yield than last year explains why production can remain historically large while still finishing below the 2025 total.
The soybean picture is different. NASS forecasts production at approximately 4.56 billion bushels, which would establish a national record and stand 7% above 2025 production.
Soybean harvested area is forecast at 85.881 million acres, up from 80.417 million acres in 2025. The national yield forecast also moved slightly above last year's level, reaching a record 53.1 bushels per acre compared with 53.0 bushels in 2025.
The national totals hide substantial variation among producing states. For corn, USDA's October yield forecast ranges from 219 bushels per acre in Iowa to much lower estimates in several drought- or weather-affected states. Illinois is forecast at 208 bushels per acre, while Nebraska's estimate increased from 177 bushels in September to 188 bushels in October.
Soybean estimates also differ considerably by state. Illinois is forecast at 68 bushels per acre, Iowa at 63, Ohio at 62, while several Plains and Southern states remain well below those levels.
USDA emphasizes that the corn and soybean numbers are forecasts prepared before harvest was complete. Based on its historical forecast performance, NASS gives a 90% probability range of 15.5 billion to 16.6 billion bushels for final corn production and 4.35 billion to 4.77 billion bushels for final soybean production. That range is an important reminder that the October figures should not be treated as final production totals.
Why It Matters
For corn growers, the October report keeps a large national supply in view without suggesting that every production region experienced the same season. The national forecast remains below 2025 because both harvested acreage and average yield are lower than last year, even after USDA raised its yield estimate from September.
That distinction matters when producers compare national statistics with their own farm results. A strong national production figure does not describe a specific county's yield, grain quality, basis, storage situation, or local cash bid.
For soybean growers, the record production forecast comes from a different combination of factors. Harvested acreage is substantially higher than in 2025, while the national average yield is forecast only slightly above last year's level. The larger crop therefore should not be interpreted simply as a nationwide surge in soybean yields.
The figures can be useful when reviewing crop budgets, storage capacity, feed availability, and marketing assumptions, but the Crop Production report does not establish where corn or soybean prices will move next. Local basis, exports, domestic use, inventories, crop quality, futures markets, and later USDA revisions all contribute additional information.
Livestock and feed operations may also watch the corn estimate because national grain production forms part of the broader feed-supply picture. As with growers, however, an aggregate USDA production forecast is not the same thing as a local delivered feed price.
What to Watch Next
The first item to watch is harvest progress. USDA NASS continues to publish weekly Crop Progress reports during the growing and harvest season, providing state and national information on harvest completion and crop conditions.
The next monthly Crop Production report is scheduled for November 10, 2026. That report will provide another opportunity for USDA to revise corn and soybean production as more harvest information becomes available.
Producers can also compare later USDA supply-and-use estimates with the new production figures. Changes in production are only one part of the balance sheet; exports, feed and residual use, crush demand, inventories, and other demand categories determine how a crop ultimately moves through the marketing year.
At the farm level, the practical comparison is between the national report and actual local results. Final field yields, grain moisture and quality, available storage, local basis, input costs, and marketing commitments can differ significantly from the national picture.
Related Farm Market Tool Resources
Source
USDA National Agricultural Statistics Service (NASS)
Crop Production
Source published
https://esmis.nal.usda.gov/sites/default/release-files/796101/crop1026.pdf
View original sourceFarm Market Tool provides agriculture news and data summaries for informational purposes. Verify important production and business decisions with original sources and appropriate local professionals. Read the Data Disclaimer.