
Livestock
U.S. Egg Production Rises 6% as Layer Flock Expands
U.S. egg production reached 9.20 billion eggs in September 2026, up 6% from a year earlier. The increase came with a 5% larger average layer flock and a 1% rise in eggs produced per 100 layers.
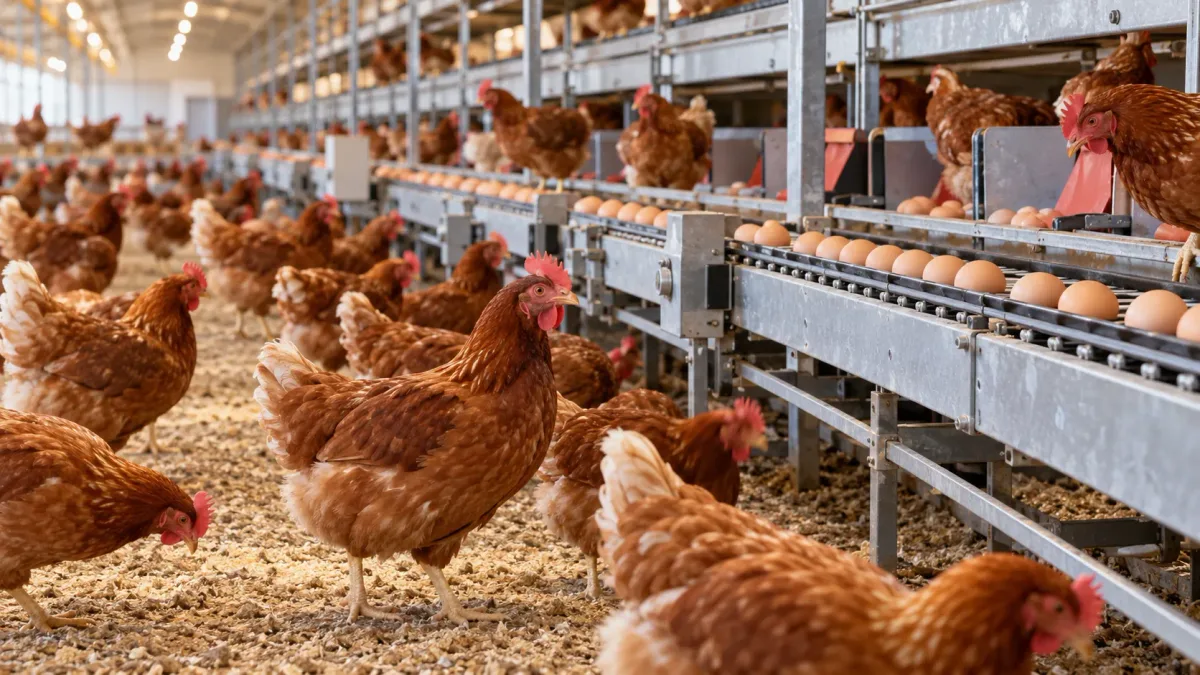
U.S. egg production increased in September as the nation's average layer flock expanded and the rate of lay edged higher.
The National Agricultural Statistics Service reported 9.20 billion eggs produced during September 2026, 6% more than in September 2025. The average number of layers during the month reached approximately 385 million birds, up 5% from a year earlier.
Production per 100 layers also increased, but by a much smaller 1%. Together, the figures show that the larger flock accounted for most of the difference in production capacity compared with last year.
The report also provides a mixed picture farther back in the production pipeline. Egg-type chicks hatched during September declined from a year earlier, even as the number of egg-type eggs in incubators on October 1 increased.
These figures describe national poultry production and flock inventories. They do not by themselves establish where retail egg prices, producer margins or feed costs will move next.
Key Facts
- U.S. egg production totaled 9.203 billion eggs in September 2026, up 6% from 8.704 billion eggs in September 2025.
- The average U.S. layer flock during September totaled 385.065 million birds, 5% above the 368.338 million layers averaged in September 2025.
- Egg production per 100 layers reached 2,390 eggs during September 2026, up 1% from 2,363 eggs per 100 layers a year earlier.
- September production included 7.932 billion table eggs and 1.271 billion hatching eggs.
- The United States had 384.582 million layers on October 1, 2026, up 4% from a year earlier, including 319.051 million layers producing table or market eggs.
- Egg-type chicks hatched during September totaled 51.3 million, down 8% from a year earlier, while egg-type eggs in incubators on October 1 totaled 56.9 million, up 2%.
What the Source Reported
The October Chickens and Eggs report shows a larger U.S. layer flock producing more eggs than it did at the same point last year.
September production totaled 9.203 billion eggs compared with 8.704 billion in September 2025. Table eggs accounted for 7.932 billion of the 2026 total, while hatching eggs accounted for 1.271 billion.
The average number of layers during September increased to 385.065 million birds from 368.338 million a year earlier. The table-egg portion of the flock averaged 319.536 million layers, while hatching-egg flocks averaged 65.529 million.
Bird numbers were not the only factor that changed. Egg production per 100 layers increased from 2,363 eggs in September 2025 to 2,390 in September 2026, a 1% year-over-year increase.
That difference is much smaller than the increase in flock size. The national figures therefore indicate that the larger number of laying birds accounted for most of the expansion in total egg output, while improved production per layer contributed a smaller part.
The October 1 inventory shows that the larger flock remained in place at the beginning of the new month. Total layers stood at 384.582 million birds, 4% above the 369.710 million reported one year earlier. Of the October 1 total, 319.051 million were producing table or market eggs.
The hatchery section of the report gives a less uniform picture of future flock supply. Egg-type chicks hatched during September totaled 51.3 million, 8% fewer than in September 2025. At the same time, 56.9 million egg-type eggs were in incubators on October 1, 2% more than a year earlier.
Domestic placements of egg-type pullet chicks for future hatchery supply flocks totaled 270,000 during September, down 1% from a year earlier.
The report also covers broiler-related hatchery activity. Broiler-type chicks hatched during September totaled 849 million, slightly above September 2025, while broiler-type eggs in incubators increased 2% to 740 million on October 1.
Why It Matters
The September figures show that U.S. egg-production capacity was larger than it was a year earlier.
For layer operations, separating flock size from production per bird is important. Total egg output rose 6%, but the average number of layers increased 5% while production per 100 layers improved only 1%. That suggests the larger flock was the main contributor to the year-over-year increase in total production.
A larger national layer flock can increase the amount of table eggs available to the market, but production volume alone does not determine egg prices. Consumer demand, inventories, regional supply, processing demand, exports, flock health, feed costs and other factors can influence the prices ultimately received by producers or paid by consumers.
The hatchery numbers are also worth separating from current egg production. Fewer egg-type chicks were hatched during September than a year earlier, but more egg-type eggs were sitting in incubators on October 1. Those indicators refer to different stages of the replacement pipeline and should not be interpreted as a simple forecast of future layer numbers.
For individual poultry farms, national flock expansion does not describe profitability. Feed typically represents a major operating cost, while labor, pullet costs, housing, energy, mortality, egg grades, contracts and local market arrangements can all materially change farm economics.
The report is therefore most useful as a national supply and production benchmark rather than a prediction of the financial outcome for a particular layer operation.
What to Watch Next
The next Chickens and Eggs report is scheduled for November 23, 2026. It will show whether the larger layer flock continued into October and whether year-over-year growth in egg production persisted.
One important comparison will be the relationship between flock size and rate of lay. If production changes more quickly than layer numbers, changes in output per bird may become a larger part of the national production story.
The egg-type hatchery pipeline is another useful measure to follow. September chicks hatched were down 8% from a year earlier, while eggs in incubators on October 1 were up 2%. Future releases will show whether those indicators begin moving in the same direction.
Producers interested in the economic side should compare production data with separate price and feed-cost information rather than assume that higher national egg output automatically produces a specific price response.
The Agricultural Prices report scheduled for October 30 can provide additional price context, while future Chickens and Eggs releases will continue to track flock size, production and hatchery activity.
Related Farm Market Tool Resources
Source
USDA National Agricultural Statistics Service (NASS)
Chickens and Eggs
Source published
https://www.nass.usda.gov/Publications/Todays_Reports/reports/ckeg1026.pdf
View original sourceFarm Market Tool provides agriculture news and data summaries for informational purposes. Verify important production and business decisions with original sources and appropriate local professionals. Read the Data Disclaimer.